Crypto Investment Dashboard:
Top Crypto Investment News, Listings, Member Posts, Crypto Investment Daily Indices and more!
- Bitcoin price is consolidating gains above the key $7,000 support area against the US Dollar.
- The price could dip towards the $6,960 support before it starts a fresh increase.
- There is a short term contracting triangle forming with resistance near $7,135 on the hourly chart of the BTC/USD pair (data feed from Kraken).
- The bulls need to gain pace above $7,135 and $7,240 to start another increase towards $7,500.
Bitcoin price is trading in a bullish zone above $7,000 and $6,960 against the US Dollar. BTC is hesitant, but it is likely to climb further above $7,300.
Bitcoin Price Analysis
Recently, we saw a sharp rise in bitcoin above the $6,800 and $7,000 resistance levels against the US Dollar. Moreover, BTC price settled above the $7,000 level and the 100 hourly simple moving average.
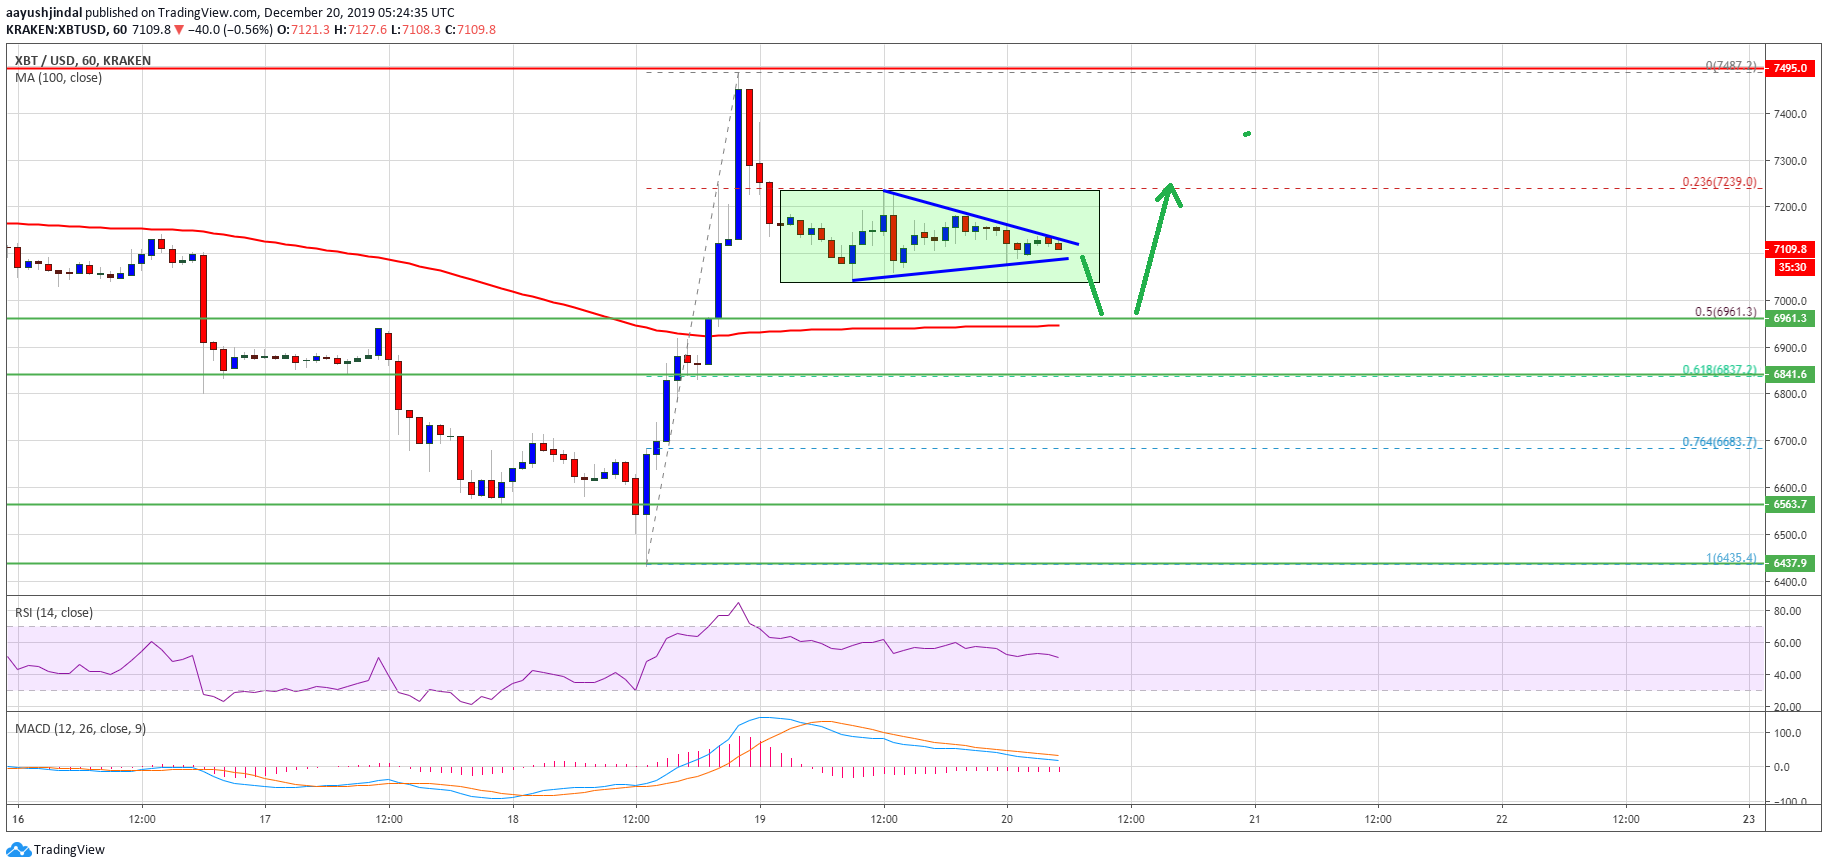
A new weekly high was formed near the $7,487 level before the price started a downside correction. It traded below the $7,200 support area. Besides, there was a break below the 23.6% Fib retracement level of the recent rally from the $6,435 low to $7,490 swing high.
However, the $7,000 support area is acting as a strong buy zone. At the moment, bitcoin price is consolidating in a range above the $7,000 support. Additionally, there is a short term contracting triangle forming with resistance near $7,135 on the hourly chart of the BTC/USD pair.
If there is an upside break above the $7,135 resistance, the price could attempt to surpass the $7,240 range resistance. A successful close above the $7,240 resistance is likely to open the doors for a fresh increase towards $7,400 and $7,500.
In the mentioned case, the price is likely to accelerate above the $7,500 resistance area. Conversely, the price extend its correction below $7,100.
The first major support is near $7,000. The next one is near the $6,960 level and the 100 hourly simple moving average. The 50% Fib retracement level of the recent rally from the $6,435 low to $7,490 swing high is also near $6,960.
Therefore, the price remains well supported near the $7,000 and $6,960 support levels. Only a daily close below $6,960 could negate the bullish view for a run towards the $7,500 level in the coming sessions.
-Bitcoin Price
Looking at the chart, bitcoin price is clearly trading in a range above the $7,000 support area. In the short term, there could be a few bearish moves towards $6,960, but the price is likely to bounce back above $7,240 and $7,300.
Technical indicators:
Hourly MACD – The MACD is slowly moving in the bearish zone.
Hourly RSI (Relative Strength Index) – The RSI for BTC/USD is declining and is just below the 50 level.
Major Support Levels – $7,000 followed by $6,960.
Major Resistance Levels – $7,240, $7,400 and $7,500.
Bitcoin (BTC) Hesitates But Further Gains Seem Likely on NewsBTC.
Today's Crypto Investment Headlines:

Access Over 250K+ Industry Headlines, Posts and Updates
Join AlphaMaven
The Premier Alternative Investment
Research and Due Diligence Platform for Investors
Free Membership for Qualified Investors and Industry Participants
- Easily Customize Content to Match Your Investment Preferences
- Breaking News 24/7/365
- Daily Newsletter & Indices
- Alternative Investment Listings & LeaderBoards
- Industry Research, Due Diligence, Videos, Webinars, Events, Press Releases, Market Commentary, Newsletters, Fact Sheets, Presentations, Investment Mandates, Video PitchBooks & More!
- Company Directory
- Contact Directory
- Member Posts & Publications
- Alpha University Video Series to Expand Investor Knowledge
- AUM Accelerator Program (designed for investment managers)
- Over 450K+ Industry Headlines, Posts and Updates


