Managed Futures Dashboard:
Top Managed Futures News, Listings, Member Posts, Managed Futures Daily Indices and more!
The Promises and Pitfalls of Factor Timing
- Jennifer Bender, Xiaole Sun, Ric Thomas and Volodymyr Zdorovtsov
- Journal of Portfolio Management
- A version of this paper can be found here
- Want to read our summaries of academic finance papers? Check out our Academic Research Insight category
What are the research questions?
- Is it possible to time factors? (An old blog on the topic here and Jack discussing on a podcast here)
- Are there financial and economic indicators that can be used to predict factor returns?
- Are timing models just luck?
What are the Academic Insights?
- YES. The authors use Fama-French 5 Factors calculated over the period 1972-2015 and forward time horizons of 1,2 and 3 months and 1,2,3 and 5 years to calculate correlations with financial and economic indicators. The authors believe it is possible to time factors based on the number of indicators that are determined to be sufficiently correlated with factor returns across the 7 time horizons.
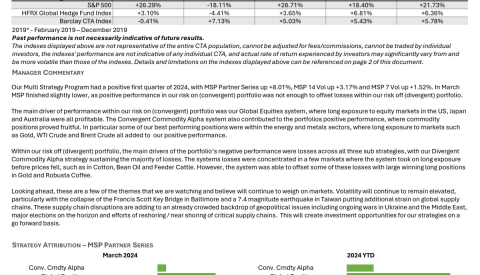
- YES. Summarized in Exhibit 7 are various indicators including: Economic (unit output growth, personal savings rate, CPI and PPI show strong correlations with Value and Investment) , Housing (nothing much to see there), Sentiment (VIX and 2 Sentiment indicators appear to be useful for Size, Value, Profitability and Investment), Valuation (Dividend and Earnings Yield are strong) and Momentum (1,2,3 and 5 year momentum show promise). The strongest relationships appear at one-year-plus horizons with mean reversion starting at 3 and 5-year horizons. There is little to no predictive ability across any indicator for 1, 3 and 6-month horizons. Correlations greater than +/-15% for Fama-French 5 Factors for the 1 year forward return for other select indicators are:
Corp Yield spread: Size (+), Value (+), Investment (+), Momentum (-)
TED spread: Size (+), Value (+), Profitability (+), Investment (+), Momentum (+)
Term spread: Value (-), Profitability (-), Investment (-), Momentum (-)
YOY in Monetary Base: Value (-), Profitability (-), Investment (-), Momentum (-)
YOY in M1: Size (-), Value (-), Profitability (-), Investment (-), Momentum (-)
YOY Comm Bank Assets: Profitability (+) - PROBABLY NOT. Dumb luck is always a possibility. The observed correlations may simply be random events for any one indicator, but it would be unlikely for all of the indicators.
Why does it matter?
Along with the challenges presented by the time-varying nature of the observed effects (the number of significant factors declined quite a bit between the subperiods 1972-1989 and 1990-2010), the authors point to methodological missteps (like cherry-picking the indicators without a strong theoretical basis) and issues with the data (many measures of economic activity and aggregate prices are often restated which can introduce possible bias when they are used in backtests).
A quote from the authors:
There is, however, a long leap between the sometimes significant correlations we have observed historically and the successful application of a factor timing model….That said, we believe timing of factors is possible as long as the horizon is sufficiently long and the timing model is given enough time to add value.
The most important chart from the paper
-The results are hypothetical results and are NOT an indicator of future results and do NOT represent returns that any investor actually attained. Indexes are unmanaged and do not reflect management or trading fees, and one cannot invest directly in an index.
Codes for Exhibit 7:
Black cells: above .75 or below -.75 Strongest relationship
Dark Gray cells: above .50 or below -.50 Next to strongest relationship
Light Gray cells: above .25 or below -.25 Next to weakest relationship
White cells: between .25 and -.25 Weakest relationship
Abstract
The potential to dynamically allocate across factors, or factor timing, has been an area of academic and practitioner research for decades. In this article, the authors revisit the promises of factor timing, documenting the historical linkages between equity factor performance and different groupings of predictors: sentiment, valuation, trend, economic conditions, and financial conditions. The authors highlight that different predictors are more relevant for certain horizons, so the horizon is critical in factor timing. They also argue there are significant pitfalls with factor timing as well. The difficulty of timing factors has been well documented, given the uncertainty of exogenous elements affecting their behavior and the complexity of the underlying relationships. Most importantly, the underlying causal links are time varying. In addition, these relationships are observed with the benefit of hindsight and thus suffer from the age-old problem of data mining. Despite these caveats, the authors believe that at the margin it is possible to time certain elements that can add value and improve outcomes.
- The views and opinions expressed herein are those of the author and do not necessarily reflect the views of Alpha Architect, its affiliates or its employees. Our full disclosures are available here. Definitions of common statistics used in our analysis are available here (towards the bottom).
- Join thousands of other readers and subscribe to our blog.
- This site provides NO information on our value ETFs or our momentum ETFs. Please refer to this site.
Investment Factor Timing: Challenging, but Not Impossible was originally published at Alpha Architect. Please read the Alpha Architect disclosures at your convenience.
Today's Managed Futures Headlines:
Access Over 250K+ Industry Headlines, Posts and Updates
Join AlphaMaven
The Premier Alternative Investment
Research and Due Diligence Platform for Investors
Free Membership for Qualified Investors and Industry Participants
- Easily Customize Content to Match Your Investment Preferences
- Breaking News 24/7/365
- Daily Newsletter & Indices
- Alternative Investment Listings & LeaderBoards
- Industry Research, Due Diligence, Videos, Webinars, Events, Press Releases, Market Commentary, Newsletters, Fact Sheets, Presentations, Investment Mandates, Video PitchBooks & More!
- Company Directory
- Contact Directory
- Member Posts & Publications
- Alpha University Video Series to Expand Investor Knowledge
- AUM Accelerator Program (designed for investment managers)
- Over 450K+ Industry Headlines, Posts and Updates