
Hedge Fund
Unintended Consequences: 12% Nominal GDP Growth
(This post was originally published on February 17, 2021.)
Overview
- US nominal and real 10s (currently 1.2%, -0.95%) are likely to rise 100-150 basis points over the following 12-14 months, with a growing tail of an overshoot.
- We see the eurodollar curve steepening as participants pull forward rate hike expectations from 2H2023 to 2H2022
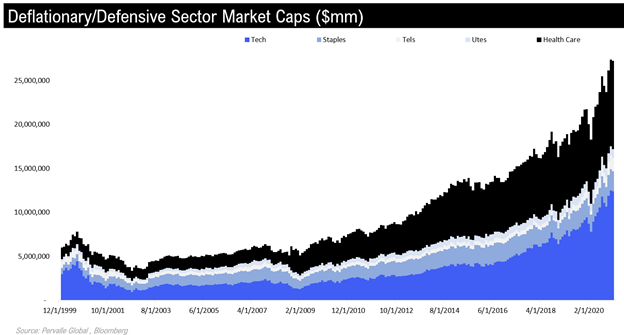
- US equities likely underperform given sector composition (68.5% of US market cap concentrated in deflationary and defensive assets -- tech, utilities, health care, staples)
- We see tech multiples compressing 20-30% due to higher real rates.
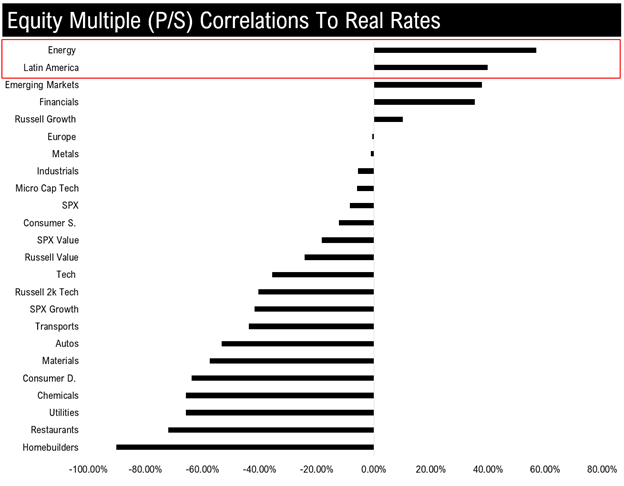
- Energy equities, as well as Latin America, likely outperform by 30-40% on the back of strong EBITDA growth and positive multiple expansion from higher real rates.
Inverse Déjà Vu
In October 2018, we wrote our first piece Bonds and Chill, which outlined why we saw US 10s falling from 3.06% to 1% over the following 12-18 months based on our leading indicators. At the time, the street was looking for 3-4 hikes, Goldman was warning of significant overheating, and Jamie Dimon saw 5% on US 10s. Today, we are getting a sense of déjà vu; however, in the opposite fashion as market participants seem to be conditioned to the view US 10s will not rise above 1.5%, and the Fed will not move for at least 2-3 years.
We have the exact opposite view, as we see the probabilities favoring US 10s at 2-2.7% over the next 12-14 months, with a growing tail of an overshoot. We can also envision a scenario where the Fed is forced to act in 2H22 due to the unintended consequences of the most recent monetary and fiscal policy – primarily in the form of a 12% nominal GDP print. Given these assumptions, we see technology unwinding on both a relative and absolute basis, while energy equities and Latin America outperform by 30-40%.
Government Inflicted Pain
The basic premise of our thesis is that fiscal and monetary policy actions are addressing a problem caused by government policymakers versus a material problem in the economy. This is to say that the current rate of joblessness is due to the government's actions to shut down the economy, which is in turn putting pressure on the services economy, rather than a cyclical impairment hindering growth. It is our view that if one removes these restrictions in full, coupled with the most recent stimulus programs and vaccine, the unemployment rate should drop significantly over the next 6-9 months. Remember, the unemployment rate is the most lagging economic indicator -- it lags growth, which is almost back to its prior highs.
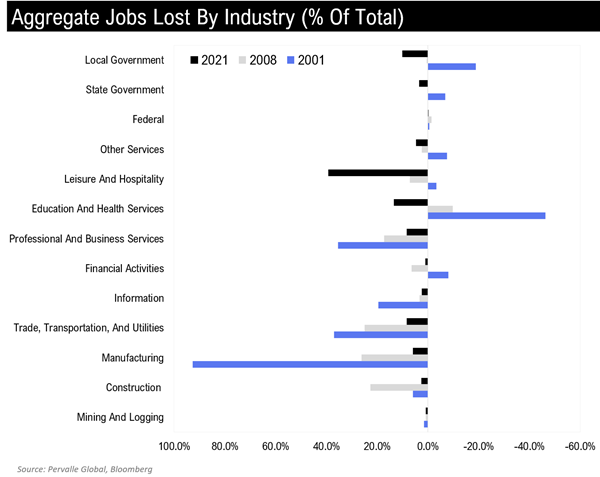
The best way to illustrate the adverse side effects of government policy is via sector job losses. As you can see below, roughly 39% of the current job losses are from leisure and hospitality -- which are a direct result of the shutdown. This compares to only 7% of jobs lost in 2008, and a net gain in the 2000 recession. On the other hand, cyclical sectors such as manufacturing, construction, and mining today make up 9.3% of total jobs lost, versus 49.6% in 2008 and 100% of jobs in the 2000 recession. The composition of job losses shows the reaction mechanism to the virus (shutdowns) is what is hindering the economy and not a cyclical impairment following the recession.
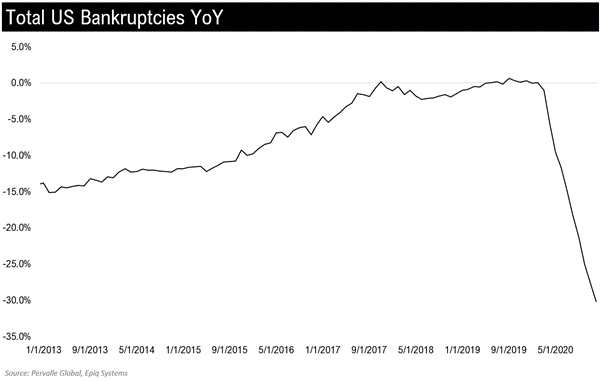
Bankruptcy data also fails to point to any cyclical impairment, as total filings are down 30% YoY. Cyclically impaired economies have rising bankruptcies and tightening financial conditions.
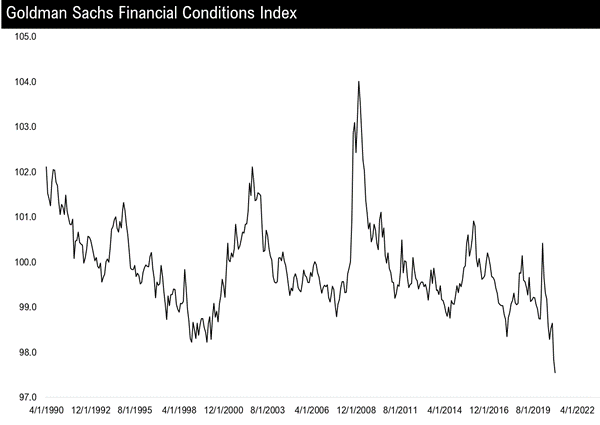
Yet today, financial conditions are currently the easiest in history.
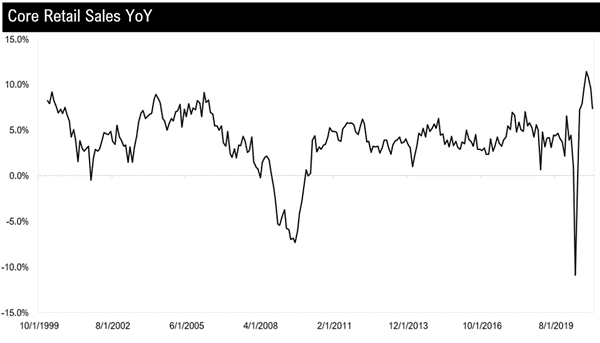
If anything, we are seeing significant strength, with core retail sales recently printing 10.8% YoY before slightly fading.
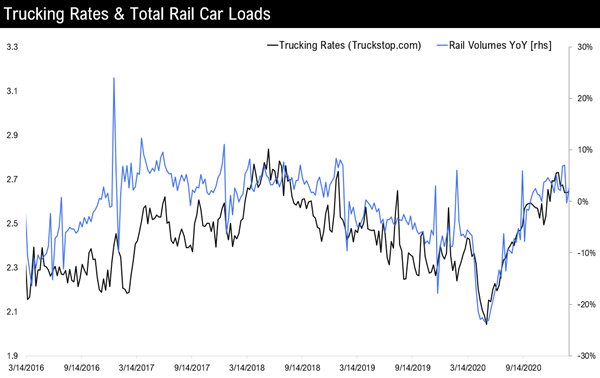
Trucking rates and rail volumes also paint a positive picture, as they have risen above their pre-Covid levels.
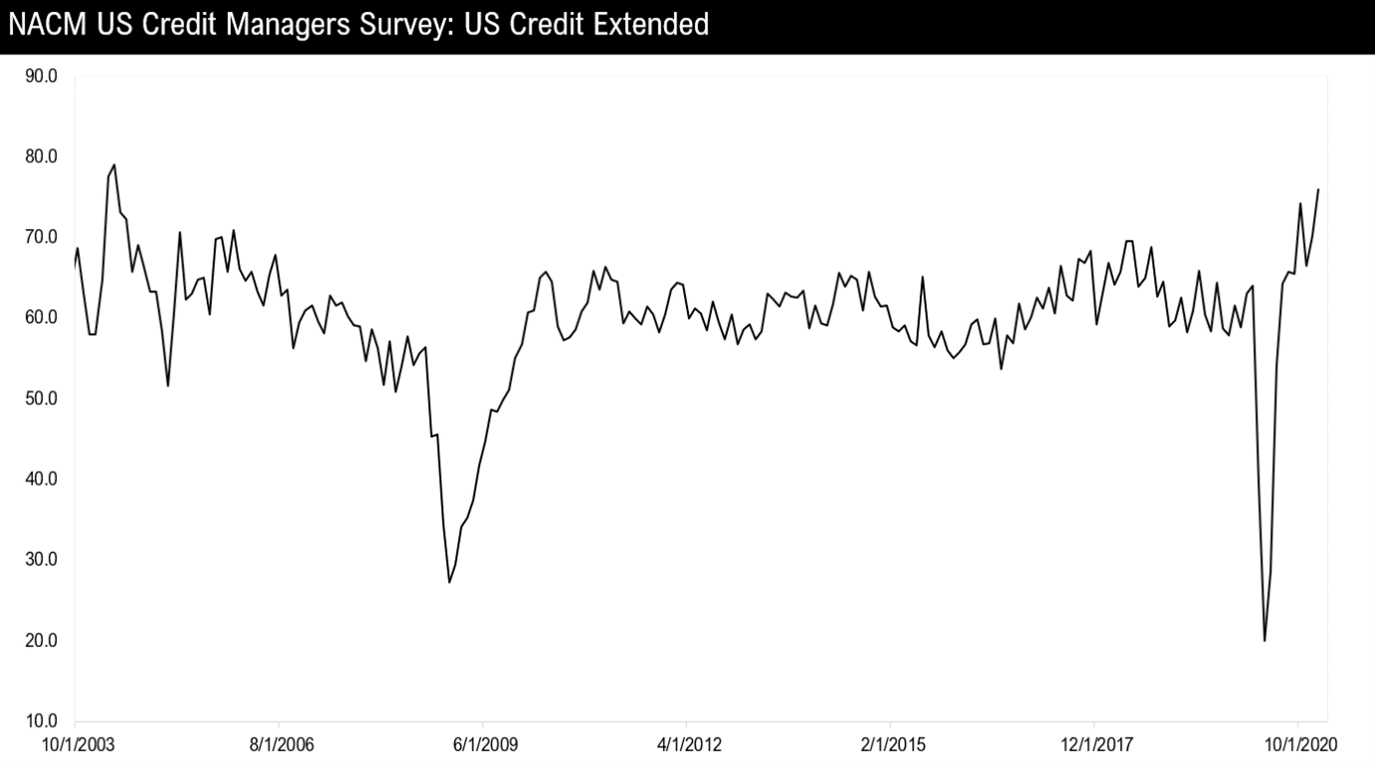
Recent credit manager data is also quite supportive of lending -- the foundation of an upcycle.
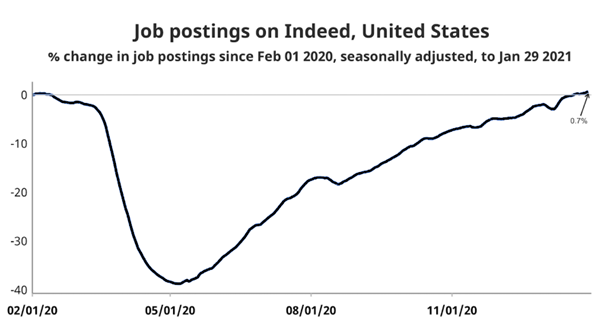
The missing piece for a full cyclical recovery continues to be jobs, which as we mentioned is a self-inflicted wound from policymakers and likely reverses over the following months. We are already seeing some very positive signs on this front in the alternative data, as job postings on indeed.com are now higher than their pre-Covid levels.
Growth Outlook
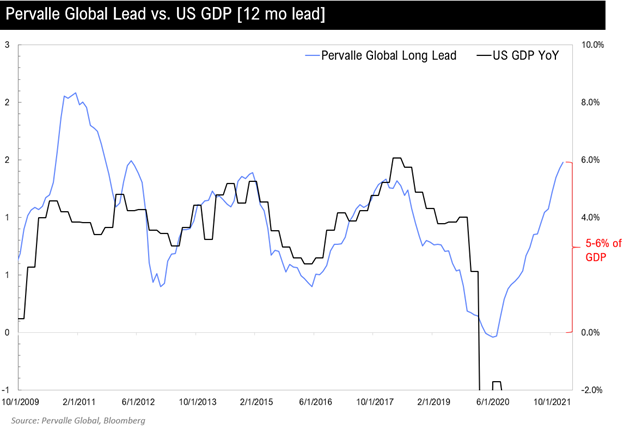
With minimal cyclical impairment and some of the largest fiscal packages in history, we think the probabilities favor the largest GDP print since the 1980s. We get here from building off our leading indicator process, which by itself is forecasting 5-6% nominal GDP over the next 12 months. Given Covid however, and the nuances of the current environment, we are assuming that only 60% (+3%) of our headline forecast makes its way into headline growth, bringing total potential GDP to 3%.
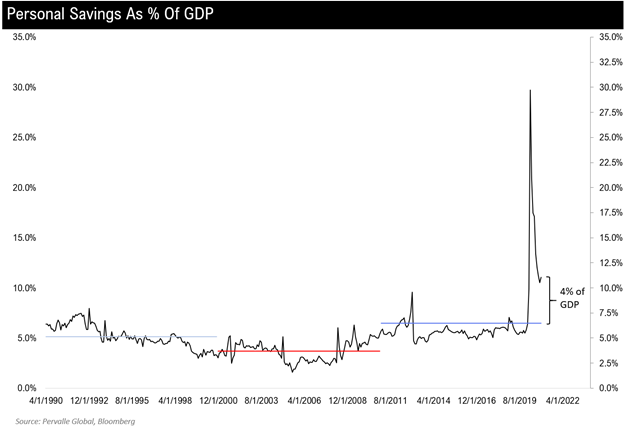
On top of our leads, we see considerable spending potential from the build-up in personal savings, which is now $905bn above the 10-year average or roughly 4% of GDP. Historically, these spikes have been drawn down, but given recent spending trends, we are assuming only 30% is additive to US GDP (+1.2%) – driving total potential GDP to +4.2%.
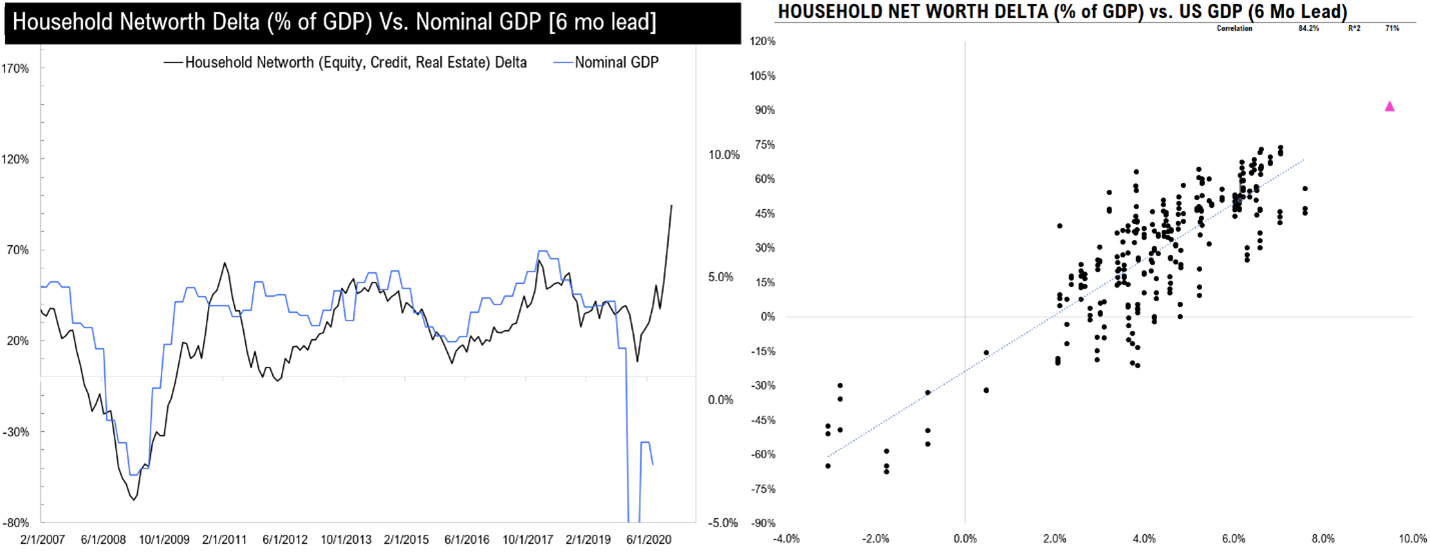
The buck does not stop here, however, as recent monetary policy has propelled household net worth higher by $13.5T (64% of GDP). We have found that changes in household net worth have historically led consumption by six months, which implies a 9% nominal GDP handle through the first-half of this year. If we assume asset prices remain constant or fade slightly, we see a similar print through year-end.
As it relates to potential GDP, we are assuming only 30% (+2.7% of GDP) of this comes through due to some overlap with our leads, taking total potential GDP to 7.1%. Additionally, we think it is fair to assume the year one-year comparisons are good for 1% of GDP, lifting total potential GDP to 8.1%.
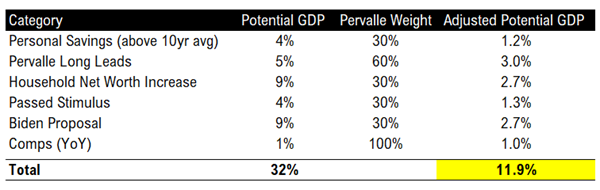
8.1% nominal GDP would be the strongest print since the 1980s, which is also before any recent stimulus measures. If we add in passed stimulus programs ($900bn) in addition to the Biden stimulus proposal ($1.9T), and assume 30% finds its way into GDP, we see potential nominal GDP at 12%.
Assumption breakdown:
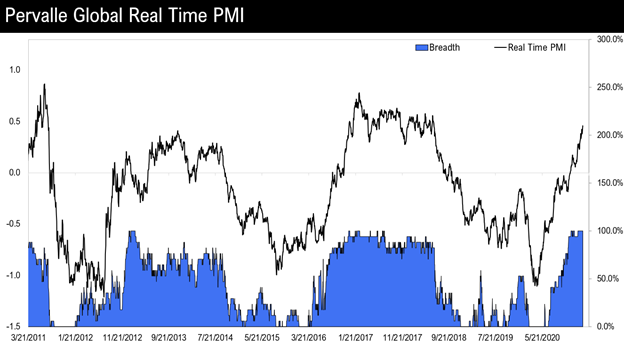
It is important to add that while our assumptions above relate to the next 12-14 months, we are currently seeing a pronounced global upturn as illustrated below by our Real Time PMI Model. This model tracks 30+ internals of global markets such as copper to gold and has a 90% correlation with the global PMI.
Market Outlook
Given current conditions and our assumptions above, we think we are set up for the strongest nominal growth print since the 1980s and a significant policy error that forces the Federal Reserve to backtrack recent dovishness.
Assuming this thesis is correct, we believe:
- Rate hike expectations will move from 2H2023 to 2H2022.
- US 10s will rise 100-150 basis points to 2.0-2.7% from 1.2% currently.
- And US 10-year reals will rise 100 basis points from -1.02% to 0%.
With such a large move in rates, we see US equities underperforming as roughly 68.5% ($27.2T) of the US market cap is tied up in deflationary and defensive assets (tech, utilities, staples, telecom, health care), which have recently had over a 90% inverse correlation with 10-year reals.
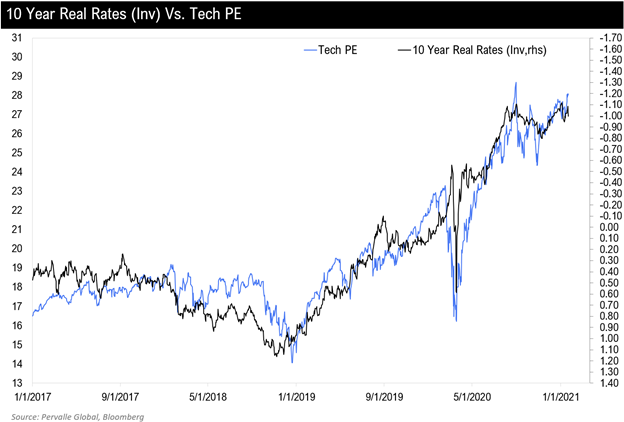
We can illustrate this relationship below via tech multiples and 10-year reals (inverted). Based on our real rate view, we can envision multiples compressing by 20-30% over the following 12 months.
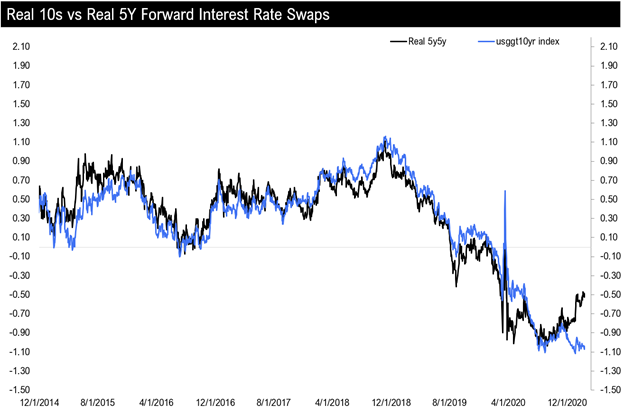
Interestingly, the swaps market is starting to price in our view of higher reals, as 5Y5Y forward real rate swaps are 50 basis points higher than 10-year reals. This would equate to a 17% cut in multiples today, assuming 10-year reals traded in-line.
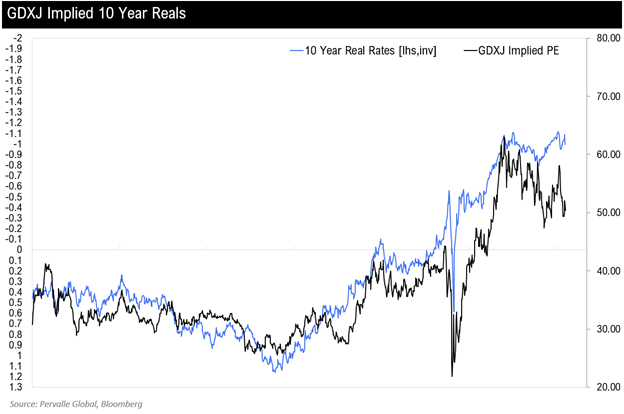
Gold miners are on the same page, as they are currently implying real 10s around -40 basis points, or a 20% decline in tech multiples.
Given this backdrop, we would look to use defensive/deflationary sectors, primarily technology, as a funding source versus more cyclical sectors and areas of the world, such as energy and Latin America. As you can see below, both Latam and energy have positive multiple correlation to rising real rates, while technology is negatively correlated.
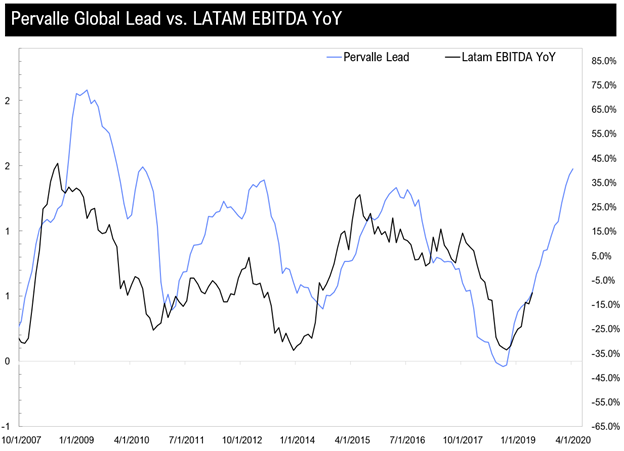
In addition to multiples, we see material upside in EBITDA growth for Latam based on our leads, which implies 47% upside in the equity.
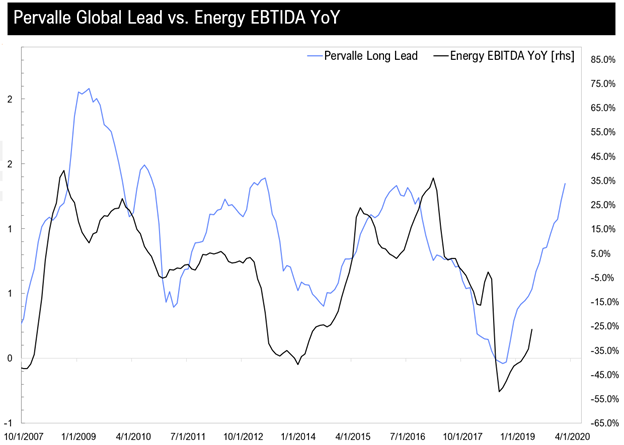
The same is true for energy, with 59% upside from current levels.
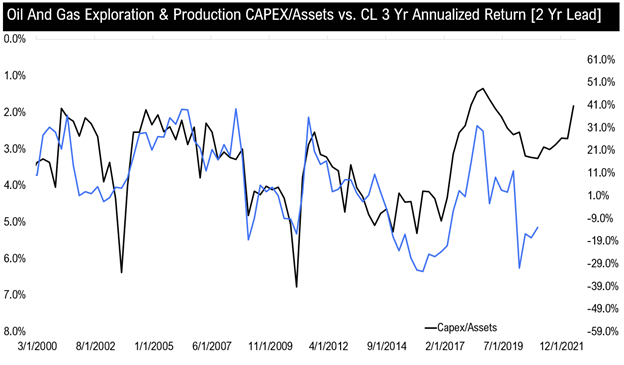
We also see a very positive tailwind for crude prices, and thus energy equities, based on recent lack of E&P capex relative to total assets. Historically, low levels of capex has restricted new supply and led crude returns by two years.
Finally, we expect both Latam and energy to benefit from the upcoming equity rotation out of deflationary and defensive assets and into cyclically oriented ones. Today, Latam and US energy represent roughly 1.8% of the global market cap, down from 6.7% in 2011. So from a positioning and flows perspective, both are set to have positive tailwinds.
Conclusion:
Over the next 12-14 months, we see significant unintended consequences of the most recent fiscal and monetary policy – primarily 12% nominal GDP growth.
Given this operating thesis, we are looking for the following:
- US 10s rising 100-150 basis points to 2.2-2.7% (current 1.2%)
- Eurodollar curves shifting higher, particularly for June-Sept of 2022 as the market begins to pick up on the growth backdrop.
- US tech unwinding as higher real rates lead to significant multiple compression.
- US equities underperforming given sector composition (68.5% of US market cap concentrated in deflationary and defensive assets -- tech, utilities, health care, staples)
Cyclical sectors such as energy and Latam having 30-40% outperformance on a relative basis.