
Key Takeaways
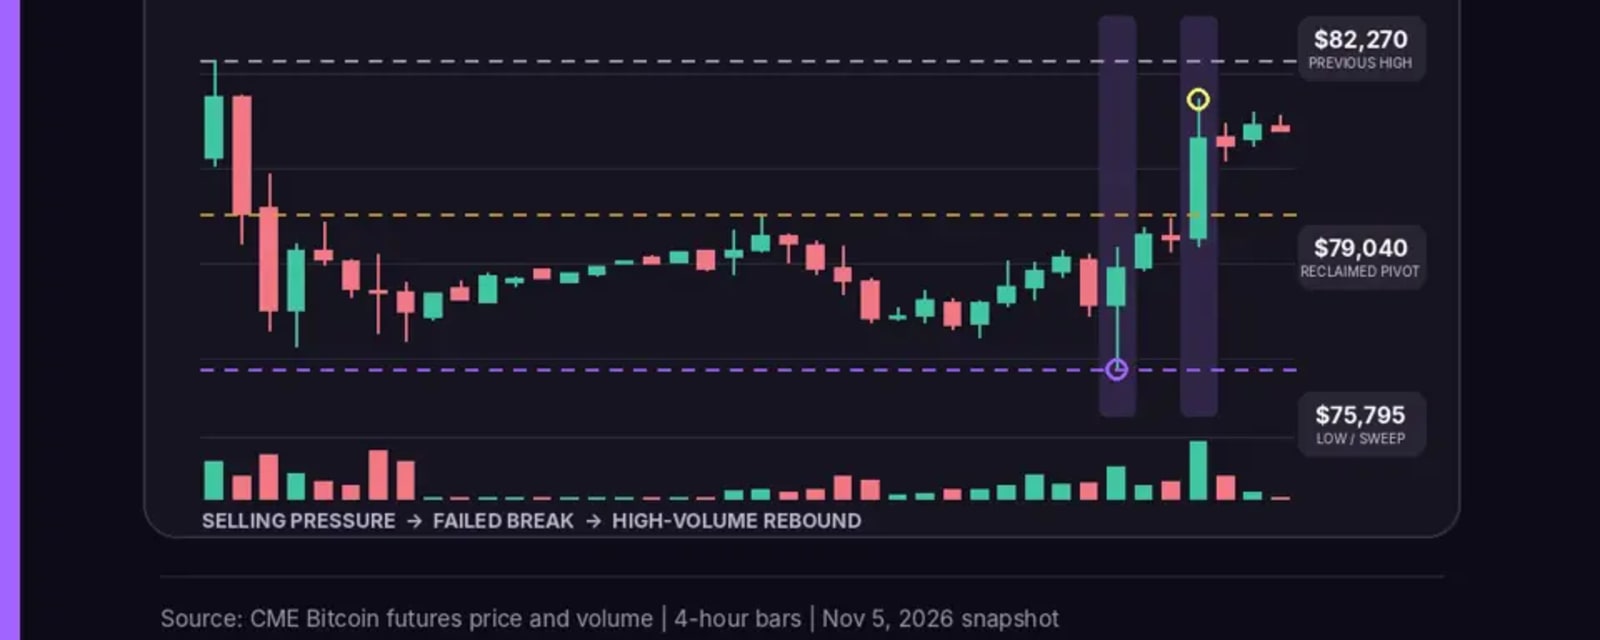
- • CME Bitcoin futures swept to $75,795 on November 3 and closed back at $77,905, a failed breakdown that was followed by a high-volume rally on November 4 that carried futures to $81,460 and a close of $80,655.
- • The November 4 session traded about 5.1 times the preceding 20-bar average volume (5,468 contracts versus 1,066), which the article treats as a notable but not calibrated signal.
- • Key levels cited are $79,040 as the pivotal support-turned-reference, $81,460 as the immediate hurdle, $82,270 as the prior high, and a $82,000 area described as a price magnet.
- • The article assigns a conditional short-term directional score of +6 on a -10 to +10 scale, explicitly not a probability or validated trading signal.
- • Macro context includes falling oil on hopes of an end to the Iran war, gold strength alongside a weaker dollar, and falling Treasury yields cited as possible crypto drivers.
Summary
Bitcoin CME futures recovered in early November after a brief break below $76,000, according to an investingLive analysis published around the US midterm elections. Sellers pushed the market to $75,795 on November 3, but the move failed and the four-hour candle closed back at $77,905. The article characterizes this as a possible liquidity sweep, while noting that the underlying stop orders and intentions cannot be independently verified from price data.
On November 4, buyers produced a more decisive move. A four-hour candle opened at $78,535, climbed to $81,460 and closed at $80,655 on volume of 5,468 contracts. The article contrasts this with October 30, when 4,576 contracts accompanied a candle body of minus $5, arguing that the November 4 session showed buyers were able to push prices higher. By the last completed bar in the November 5 snapshot, futures had closed at $80,925. These are dated CME continuous-futures observations rather than live spot quotes.
The article identifies $79,040 as the pivotal reference, since it repeatedly capped recovery attempts before November 4. The first nearer support zone is $80,160-$80,465, with $81,460 as the breakout-session high and $82,270 as the earlier high. A companion analysis of a BTCUSD chart snapshot describes $82,000 as a price magnet, citing clustered historical references near $81,900-$82,000, and lists $80,750-$80,900, $81,850-$81,975 and $82,050-$82,150 as areas to monitor, with $79,900 and $79,122 as downside references.
The article frames three scenarios: a bullish continuation if buyers clear $81,460 and hold above $82,270; constructive consolidation if a pullback toward $80,160-$80,465 or $79,040 is absorbed; and a failed breakout if price loses $79,040, which would bring $77,417 and the $75,795 low into focus. It explicitly declines to forecast either direction.
Macro context is presented as an incomplete explanation. Oil fell sharply on expectations of an end to the Iran war, which the article describes as a market expectation rather than a completed diplomatic deal. Gold rose alongside falling oil and a weaker dollar. The article also notes that investors rewarded the prospect of slower hyperscaler data-center spending, suggesting selective risk appetite rather than a uniform rally. A closing section draws a parallel to September 1 trading in Japan, where 168 of the Nikkei's 225 stocks were rising at one point even as the index slipped.
On November 4, buyers produced a more decisive move. A four-hour candle opened at $78,535, climbed to $81,460 and closed at $80,655 on volume of 5,468 contracts. The article contrasts this with October 30, when 4,576 contracts accompanied a candle body of minus $5, arguing that the November 4 session showed buyers were able to push prices higher. By the last completed bar in the November 5 snapshot, futures had closed at $80,925. These are dated CME continuous-futures observations rather than live spot quotes.
The article identifies $79,040 as the pivotal reference, since it repeatedly capped recovery attempts before November 4. The first nearer support zone is $80,160-$80,465, with $81,460 as the breakout-session high and $82,270 as the earlier high. A companion analysis of a BTCUSD chart snapshot describes $82,000 as a price magnet, citing clustered historical references near $81,900-$82,000, and lists $80,750-$80,900, $81,850-$81,975 and $82,050-$82,150 as areas to monitor, with $79,900 and $79,122 as downside references.
The article frames three scenarios: a bullish continuation if buyers clear $81,460 and hold above $82,270; constructive consolidation if a pullback toward $80,160-$80,465 or $79,040 is absorbed; and a failed breakout if price loses $79,040, which would bring $77,417 and the $75,795 low into focus. It explicitly declines to forecast either direction.
Macro context is presented as an incomplete explanation. Oil fell sharply on expectations of an end to the Iran war, which the article describes as a market expectation rather than a completed diplomatic deal. Gold rose alongside falling oil and a weaker dollar. The article also notes that investors rewarded the prospect of slower hyperscaler data-center spending, suggesting selective risk appetite rather than a uniform rally. A closing section draws a parallel to September 1 trading in Japan, where 168 of the Nikkei's 225 stocks were rising at one point even as the index slipped.
Go deeper than the headline
Research every firm in this story, track the ones that matter and get the daily briefing — free for 7 days.