
Key Takeaways
- • Multi-timeframe signal divergence: American Tower Corporation (AMT) exhibits strong near-term bullish signals ($185.33 support, $190.01 resistance) but neutral mid-term and weak long-term positioning, indicating choppy market conditions across different holding periods.
- • Elevated downside risk profile: Technical analysis identifies no additional long-term support signals below current levels, creating asymmetric downside exposure for longer-duration positions despite near-term strength.
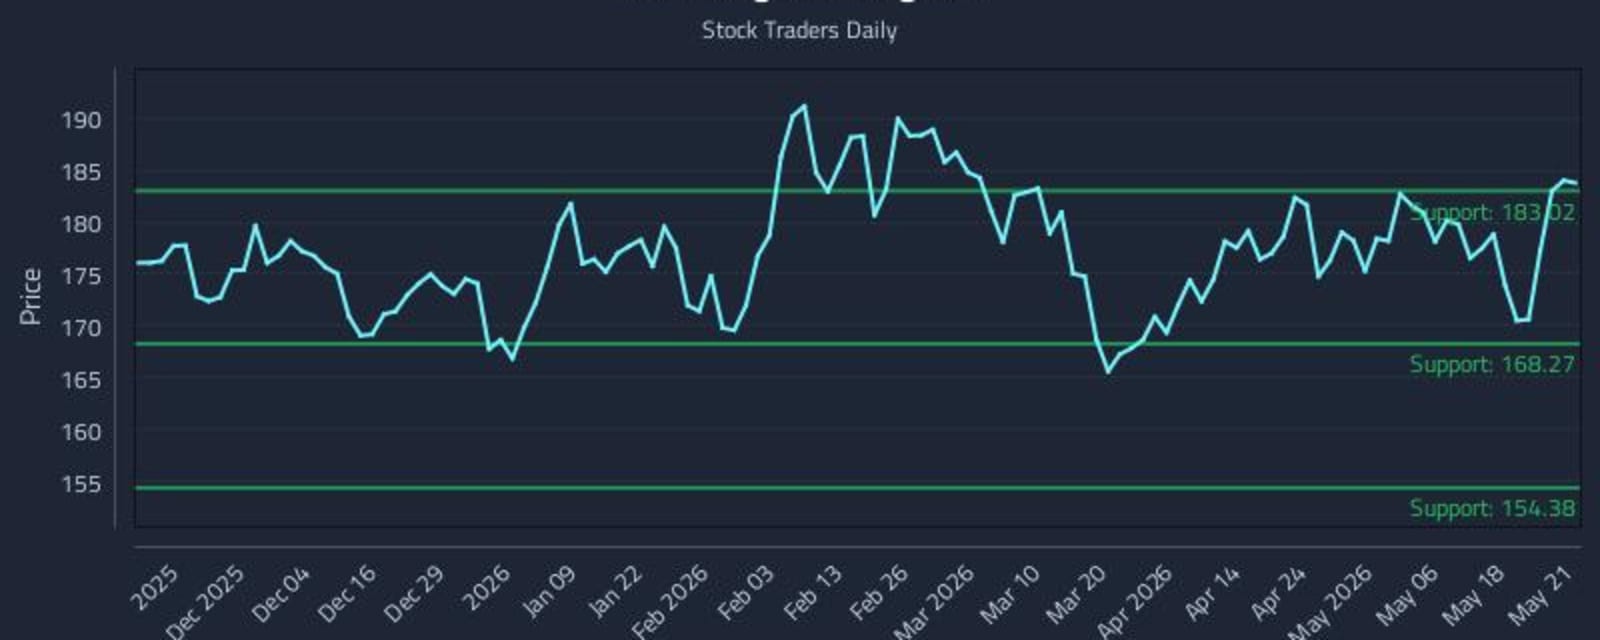
- • Current price positioning at $183.24: AMT trades near upper-mid resistance levels, with key signal thresholds at $154.38, $168.27, $183.02, and $183.24, requiring disciplined risk management across institutional portfolios.
- • AI-driven strategy framework: Quantitative models have generated three distinct trading strategies calibrated to different risk profiles and holding periods, incorporating sophisticated position sizing and drawdown optimization parameters.
- • Market cap and volatility context: With a market capitalization of $81.69 billion and a beta of 0.13, AMT demonstrates low sensitivity to broader market movements, though recent performance has declined 13% over one year.
Summary
American Tower Corporation (NYSE: AMT), one of the largest global REITs specializing in multitenant real estate ownership and operation, presents a mixed technical outlook requiring nuanced institutional positioning as of May 22, 2026. According to the Quantitative Research Desk analysis, the REIT exhibits divergent sentiment signals across multiple time horizons, with near-term conditions showing strength while longer-duration outlooks deteriorate.
Near-term trading signals (1–5 days) demonstrate strong bullish alignment, with support established at $185.33 and resistance at $190.01. This contrasts sharply with mid-term signals (5–20 days), which turn neutral with support at $174.28 and resistance at $183.89, and long-term signals (20+ days), which weaken considerably with support at $168.27 and resistance at $183.02. The current price of $183.24 positions AMT near intermediate resistance levels, creating tactical entry and exit considerations for varying investment horizons.
A critical risk parameter identified in the analysis involves the absence of additional long-term support levels below current pricing, creating elevated downside vulnerability for positions held beyond the 20-day horizon. This technical breakdown suggests that positions established at current levels face asymmetric risk, with limited price discovery support should momentum deteriorate. The divergent signal structure—strong near-term alignment versus weak longer-term confirmation—indicates choppy market conditions likely to produce volatile price action.
The underlying REIT operates with a market capitalization of $81.69 billion and a beta coefficient of 0.13, indicating minimal correlation with broader equity market movements. Recent performance has underperformed broader real estate indexes, declining 13% over the trailing twelve-month period, despite the stock's low volatility characteristics relative to market benchmarks. The analysis incorporates AI-generated trading strategies tailored to distinct risk profiles and holding periods, with emphasis on position sizing optimization and drawdown risk mitigation across institutional portfolios.
Near-term trading signals (1–5 days) demonstrate strong bullish alignment, with support established at $185.33 and resistance at $190.01. This contrasts sharply with mid-term signals (5–20 days), which turn neutral with support at $174.28 and resistance at $183.89, and long-term signals (20+ days), which weaken considerably with support at $168.27 and resistance at $183.02. The current price of $183.24 positions AMT near intermediate resistance levels, creating tactical entry and exit considerations for varying investment horizons.
A critical risk parameter identified in the analysis involves the absence of additional long-term support levels below current pricing, creating elevated downside vulnerability for positions held beyond the 20-day horizon. This technical breakdown suggests that positions established at current levels face asymmetric risk, with limited price discovery support should momentum deteriorate. The divergent signal structure—strong near-term alignment versus weak longer-term confirmation—indicates choppy market conditions likely to produce volatile price action.
The underlying REIT operates with a market capitalization of $81.69 billion and a beta coefficient of 0.13, indicating minimal correlation with broader equity market movements. Recent performance has underperformed broader real estate indexes, declining 13% over the trailing twelve-month period, despite the stock's low volatility characteristics relative to market benchmarks. The analysis incorporates AI-generated trading strategies tailored to distinct risk profiles and holding periods, with emphasis on position sizing optimization and drawdown risk mitigation across institutional portfolios.
Go deeper than the headline
Research every firm in this story, track the ones that matter and get the daily briefing — free for 7 days.